Japan's Economy Stalls in the Third Quarter as Imports Surge, and Final Sales Fall 0.5%
- ▸Japan's real GDP fell 0.02% in July to September 2026, a 0.1% annualised decline and the first fall since the same quarter of 2025, according to the Cabinet Office's first preliminary estimate published on 16 November 2026. Growth in April to June was revised up to 1.7% annualised.
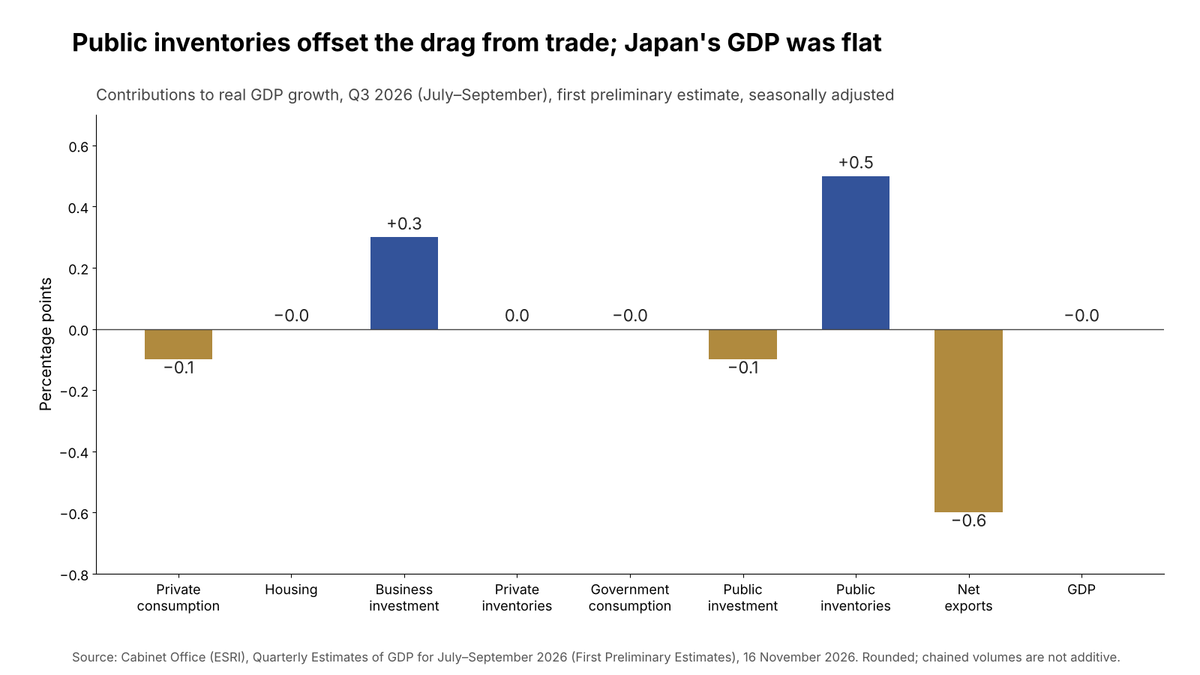
- ▸Business investment rose 1.6% and domestic demand 0.6%, but private consumption fell 0.3% for a second quarter, and imports jumped 2.5% while exports slipped 0.2%, so net exports subtracted 0.6 percentage points.
- ▸EconoLens analysis: a 0.5-point contribution from public inventories kept the headline flat. Final sales, which exclude all inventory changes, fell 0.5%, and real gross domestic income fell 0.4% as import prices outran export prices. Even so, carry-over alone would give fiscal 2026 growth of about 0.8%, above the Bank of Japan's 0.7% projection, an EconoLens calculation.
Japan's economy stopped growing in the third quarter of 2026. Real gross domestic product (GDP), the inflation-adjusted value of goods and services produced, was 0.02% lower in July to September than in April to June. That is −0.1% at an annualised rate, the way Japan's Cabinet Office headlines the figure, and it ends three quarters of growth.
The fall is small, but where it came from matters. Households spent less for a second quarter, while firms invested more. Imports rose while exports fell, in a year when the Bank of Japan expects higher energy and raw material prices, linked to the situation in the Middle East, to push down activity.
The question this article addresses is whether the flat headline describes the economy fairly, or whether underlying demand was weaker or stronger than the 0.0% suggests.
What the figures show
The estimate comes from the Economic and Social Research Institute (ESRI) of the Cabinet Office, which publishes a first preliminary estimate about six weeks after each quarter ends. All figures below are real, seasonally adjusted and compared with the previous quarter unless stated.
| Japan, real GDP and components | Q3 2026, % change on previous quarter | Contribution to GDP growth (percentage points) |
|---|---|---|
| Real GDP | -0.0 | -0.0 |
| Private consumption | -0.3 | -0.1 |
| Private residential investment | -1.1 | -0.0 |
| Private non-residential investment | 1.6 | 0.3 |
| Government consumption | -0.0 | -0.0 |
| Public investment | -1.1 | -0.1 |
| Change in private inventories | n/a | 0.0 |
| Change in public inventories | n/a | 0.5 |
| Exports | -0.2 | -0.0 |
| Imports | 2.5 | -0.5 |
| Net exports | n/a | -0.6 |
| Domestic demand | 0.6 | 0.6 |
| Final sales of domestic product (excludes all inventories) | -0.5 | -0.5 |
On the previous year, real GDP was 1.1% higher than in July to September 2025 (original, not seasonally adjusted, series). Nominal GDP, which includes price changes, rose 0.4% on the quarter and 3.6% on the year. The GDP deflator, the broadest measure of domestic prices, was 2.4% higher than a year earlier, down from 2.6% in the second quarter.
The previous quarter now looks stronger than first reported. Growth in April to June was first estimated at 1.1% annualised in August, revised to 1.4% in September and is now 1.7%.
Why demand and output moved apart
Two forces pulled in opposite directions. Domestic demand added 0.6 points to growth. Business investment supplied half of that, rising 1.6% after two quarterly falls, and its 0.3-point contribution was the largest positive one from private spending.
Trade took it away. Imports rose 2.5% in volume and exports fell 0.2%, so net exports subtracted 0.6 points. A rise in imports is subtracted from GDP because the spending it represents is on goods and services produced abroad.
Households were the weak spot. Private consumption, about 52% of nominal GDP, fell 0.3% after a 0.3% fall in the second quarter. Household prices are rising faster: the private consumption deflator was 2.9% higher than a year earlier, up from 2.0% in the first quarter.
Prices of traded goods moved sharply. The import deflator was 17.2% higher than a year earlier and the export deflator 12.6% higher. When import prices rise faster than export prices, a country's terms of trade worsen: each unit of exports buys fewer imports.
EconoLens Analysis: the flat headline flatters underlying demand
The 0.0% headline overstates the underlying strength of Japan's economy in the third quarter, on two measures.
The first is inventories. ESRI's figures show changes in public inventories, which are stocks held by the government and public bodies, adding 0.5 points to growth. They had subtracted 0.5 points in the second quarter, so the third quarter's contribution largely reverses that earlier drag; ESRI's level data show a much smaller drawdown of those stocks than in April to June. Final sales of domestic product, which exclude all inventory changes, fell 0.5% on the quarter, after a 0.7% rise in April to June. Private demand, the sum of household and business spending and private inventories, added only 0.1 points.
The second is income. Real gross domestic income (GDI) adjusts output for changes in the terms of trade, and it fell 0.4%, against −0.0% for GDP. ESRI's estimate of the trading loss subtracted 0.3 points. In plain terms, the higher prices Japan paid for imports, relative to what it earned on exports, reduced the real purchasing power of its output.
On both measures, the economy weakened more than GDP shows. Without the swing in public inventories, GDP would have fallen by roughly 0.4% to 0.5%, or about 1.5% to 2% at an annualised rate. The range reflects a measurement choice: ESRI's published contribution puts the swing at 0.5 points, while its chained level data put it nearer 0.4, because chained volumes are not strictly additive.
The strongest evidence against this reading is business investment. A 1.6% rise is the biggest since the fourth quarter of 2025 (1.7%), and it fits the Bank of Japan's expectation that business investment stays on a moderate increasing trend. Domestic demand grew 0.6%, nominal GDP grew 0.4% and real GDP was 1.1% higher than a year earlier. Inventory swings also reverse: the same public-stock item that flattered the third quarter depressed the second.
First estimates also move a lot. Second-quarter growth has been revised from 1.1% to 1.7% annualised since August, so a revision of that size to the third quarter would turn the decline into growth. The evidence is consistent with an economy in which firms are investing but households and real incomes are being squeezed by import prices, not with an economy in recession.
Where the assessments disagree
The Bank of Japan, in its October 2026 Outlook Report, expects the economy to keep growing moderately in fiscal 2026 (April 2026 to March 2027), at a slower pace than before. The median of Policy Board members' forecasts is 0.7% real growth, within a range of 0.7% to 0.8%. The Bank expects higher energy and raw material prices to weigh on activity, offset by government measures, accommodative financial conditions and AI-related demand, and it judges the risks to activity to be generally balanced. The projection was made before the third-quarter estimate and the latest upward revision to the second quarter.
The third-quarter figures do not undermine that projection on arithmetic alone. Because the economy grew in the previous three quarters, the July–September level was already about 0.8% above the average for fiscal 2025. If GDP stayed flat for the rest of the fiscal year, fiscal 2026 growth would be about 0.8%, an EconoLens calculation from seasonally adjusted quarterly levels. To fall below 0.7%, GDP would have to shrink by roughly 0.15% in each of the next two quarters.
Consumption is where the data look weaker than the Bank's description. The October report says private consumption has been resilient and expects it to be more or less flat for now, held back by energy prices and weather, before returning to a moderate increasing trend as price rises ease. The national accounts show two consecutive falls of 0.3%, a weaker path than flat. Exports are a second gap: the Bank expects them to keep increasing moderately, but they fell 0.2% in the third quarter.
The Bank's own board is divided on the policy response. At its meeting on 30 October 2026 it held its policy rate at around 1.25% by 8 votes to 1; one member proposed raising it to around 1.5%. The board's median forecast for consumer prices excluding fresh food in fiscal 2026 is 2.5%, and 2.4% excluding fresh food and energy, and it sees the risks to prices as skewed to the upside. For a member worried about inflation, the third-quarter deflators, with household prices up 2.9%, support tightening. Weak consumption and falling real income are the case for waiting.
Global implications
Japan's import surge is other economies' export gain. Japanese import volumes rose 2.5% in a quarter when its exports fell, so Japan added to demand for foreign production. The Bank of Japan links the rise in import costs to energy and raw material prices; ESRI's headline tables do not split import volumes or prices by product.
Japan's third quarter also stands out among large economies. On the comparison table the UK's Office for National Statistics compiled from OECD data, the United States grew 0.8% in the same quarter, the UK 0.7%, Canada 0.3% and Germany 0.2%. France (−0.1%) and Italy (0.0%) did not grow either, so Japan joins them among the G7 economies whose output stalled or fell in July to September.
What happens next
- 8 December 2026: Cabinet Office second preliminary estimate for July to September, with fuller data on business investment.
- 17–18 December 2026: Bank of Japan Monetary Policy Meeting.
The indicators to watch are whether the second estimate keeps business investment near 1.6%, whether household spending stops falling, and whether import prices ease as the energy shock fades.
Conclusion
Japan's economy did not grow in the third quarter of 2026, and on the measures that strip out inventory swings and price effects it weakened. Final sales fell 0.5% and real income 0.4%, while household spending fell for a second quarter. Business investment and an upward-revised second quarter show the economy is not in recession, and on carry-over alone fiscal 2026 growth would still meet the Bank of Japan's projection. The decision facing the Bank in December is whether squeezed households or rising prices matter more.
The data and the working
Real GDP, seasonally adjusted levels (billion yen, chained 2020 prices, annualised): Q2 2026 599,598.8; Q3 2026 599,455.9. Change 599,455.9 ÷ 599,598.8 − 1 = −0.024%; annualised (1 − 0.00024)^4 − 1 = −0.10%.
Private consumption share of nominal GDP: 362,788.2 ÷ 692,679.5 = 52.4% (51.5% on chained real levels).
GDP without public inventories: ESRI contribution of GDP −0.0 minus public inventories +0.5 = about −0.5 points; annualised (1 − 0.005)^4 − 1 = −2.0%. On ESRI's levels, public inventories moved from −2,329.6 to −195.3 billion yen, a change of 2,134.3 billion, or 0.36% of second-quarter GDP; GDP less public inventories falls 0.38%, or −1.5% annualised. The gap between the two methods reflects chain-linking. Final sales of domestic product, published directly by ESRI: 603,461.3 to 600,267.4, −0.53%.
Terms of trade: import deflator 17.2% minus export deflator 12.6% = 4.6 points (year on year, Q3 2026).
Fiscal 2026 carry-over: fiscal 2025 seasonally adjusted quarterly levels 594,841.1, 592,604.6, 594,212.2 and 597,012.4 average 594,667.6. Q3 2026 ÷ that average − 1 = 0.81%. With Q2 and Q3 2026 at their estimated levels and Q4 2026 and Q1 2027 unchanged from Q3, fiscal 2026 growth is 0.81%; at 0.1% a quarter, 0.89%. Growth of about −0.15% a quarter would bring it to 0.7%. These calculations use quarterly seasonally adjusted levels and will differ slightly from ESRI's fiscal-year figures, which use original series.
Second-quarter revisions (annualised): 1.1% (17 August), 1.4% (8 September), 1.7% (16 November); total +0.6 points. All other figures are rounded to one decimal place as published by ESRI.
Related reading
Japan GDP growth indicator, Canada hikes as the Fed, ECB and Bank of Japan hold, UK economy grows 0.7% in the third quarter, Hiking into an oil shock, Business cycles explained, Understanding GDP: what the number actually measures and Japan's exports jump 23.2% in July, but energy imports widen the deficit.
FAQ
How did Japan's economy perform in the third quarter of 2026? Real GDP was 0.02% lower in July to September 2026 than in April to June, a 0.1% annualised decline, according to the Cabinet Office's first preliminary estimate published on 16 November 2026. It was 1.1% higher than a year earlier.
Why did Japan's GDP fall? Net exports subtracted 0.6 percentage points, because imports rose 2.5% while exports fell 0.2%, and private consumption fell 0.3%. Business investment rose 1.6% and public inventories added 0.5 points, which kept the decline close to zero.
What are final sales of domestic product? Final sales are GDP excluding changes in inventories. They show demand for goods and services in a quarter without the effect of firms or the government building up or running down stocks. In Japan they fell 0.5% in the third quarter of 2026.
What is the difference between GDP and GDI? Gross domestic income (GDI) measures the real income generated by production, allowing for changes in the terms of trade. When import prices rise faster than export prices, real GDI grows more slowly than GDP. Japan's real GDI fell 0.4% in the third quarter.
Is Japan in recession? No. One quarter of a fractional fall does not meet the common rule of thumb of two consecutive quarterly declines, and the second quarter was revised up to 1.7% annualised. The figure is a first estimate; the second estimate is due on 8 December 2026.
Sources
- Cabinet Office, Economic and Social Research Institute: Quarterly Estimates of GDP for July–September 2026 (First Preliminary Estimates), data tables, 2026-11-16
- Cabinet Office, Economic and Social Research Institute: Quarterly Estimates of GDP for April–June 2026 (Second Preliminary Estimates), data tables, 2026-09-08
- Cabinet Office, Economic and Social Research Institute: Quarterly Estimates of GDP for April–June 2026 (First Preliminary Estimates), data tables, 2026-08-17
- Cabinet Office, Economic and Social Research Institute: Quarterly Estimates of GDP, release archive 2026, accessed 2026-11-16
- Cabinet Office, Economic and Social Research Institute: Release schedule, accessed 2026-11-16
- Bank of Japan: Outlook for Economic Activity and Prices, October 2026 (The Bank's View), 2026-10-30
- Bank of Japan: Statement on Monetary Policy, 2026-10-30
- Bank of Japan: Monetary Policy Meetings schedule, accessed 2026-11-16
- Office for National Statistics: GDP first quarterly estimate, UK: July to September 2026, 2026-11-12
Disclaimer: This article is for informational purposes only and does not constitute investment advice. EconoLens is not a SEBI-registered investment advisor. Please consult a qualified financial advisor before making investment decisions.
This article covers Japan's national accounts and the Bank of Japan's outlook; it does not attempt an India-specific assessment, as the release has no direct India channel.
Primary Sources
Cite This Article
Khagan Rao. (2026, November 16). Japan's Economy Stalls in the Third Quarter as Imports Surge, and Final Sales Fall 0.5%. EconoLens. https://www.econolens.co.in/news/japan-gdp-q3-2026-first-estimate-stalls-public-inventories
Khagan Rao is an economist and analyst specialising in global monetary policy, fiscal frameworks, and international trade. He tracks publications from the IMF, World Bank, BIS, and RBI to deliver accessible, data-driven analysis for a global audience.