Hiking Into an Oil Shock: Where the Case for Higher Rates Holds, and Where It Doesn't
- ▸Four major central banks decide policy between 28 and 30 October 2026, with headline inflation at 3.7% in the United States, 3.8% in the euro area and 3.1% in Canada. The Fed and the ECB have each raised rates this year, and the Bank of Japan raised its policy rate to around 1.25% in September.
- ▸Energy's role differs sharply by economy. In Canada, core inflation is below 2% and energy explains nearly all the overshoot. In the euro area, energy accounts for about 45% of inflation, and underlying inflation is 2.5%. In the US, underlying inflation on the Fed's preferred measure (core PCE) is 3.0%, only 0.4 points below the headline rate.
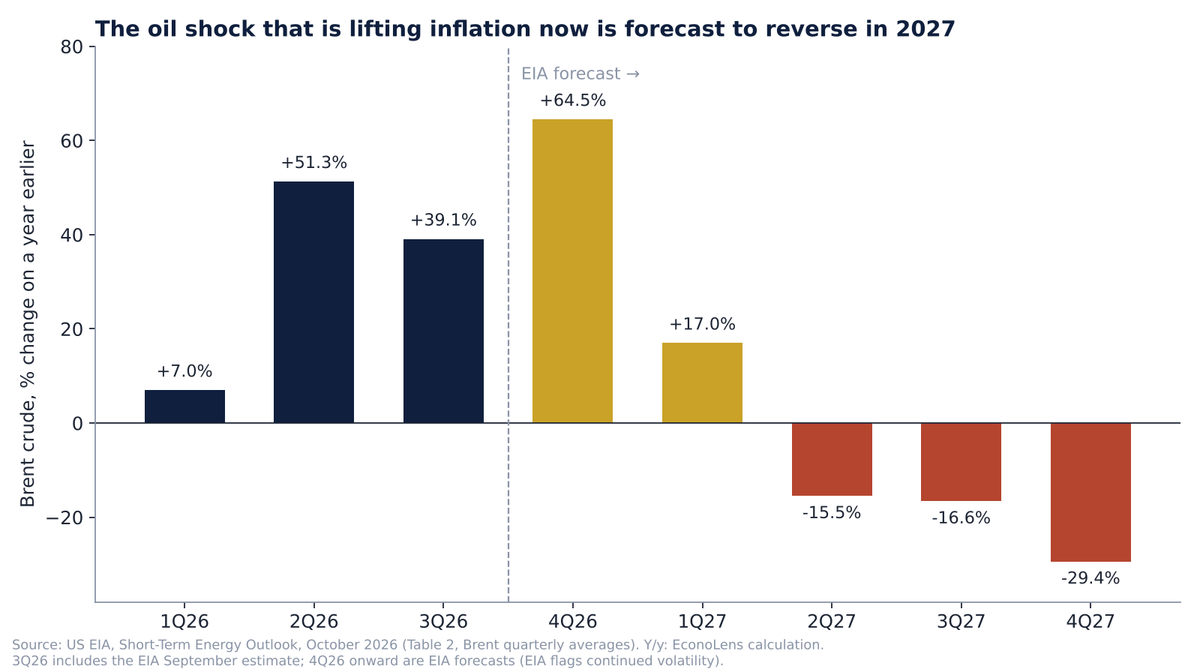
- ▸EconoLens analysis: against underlying inflation, policy is roughly neutral in all three economies, not restrictive. Oil is forecast by the US Energy Information Administration to swing from 39% above year-earlier levels in the third quarter to about 29% below by late 2027. That argues for patience in Canada and caution about a series of hikes in the euro area. In the US, underlying inflation is itself the problem, and the case for holding rests on a cooling labour market rather than on energy.
Reviewed by: EconoLens Economics Desk
Between 28 and 30 October, four of the world's most watched central banks will set interest rates within roughly 48 hours of each other. The Bank of Canada announces on the morning of the 28th, the US Federal Reserve that afternoon, the European Central Bank on the 29th and the Bank of Japan on the 30th. They meet against the same awkward backdrop.
Inflation has climbed back towards 4% in the two largest advanced economies. In the United States, consumer prices rose 3.7% in the year to September, up from 3.0% a year earlier. In the euro area, inflation reached 3.8%, up from 2.2% a year earlier, when it was close to the target. The Fed has already raised its policy range to 3.75%–4.00%, and the ECB has lifted its deposit rate twice this year, in June and September, to 2.50%.
Reviewing the numbers as economists, the question we think matters is not whether inflation is too high. It plainly is. The question is what kind of inflation it is, and whether higher interest rates are the right tool for it. The answer differs by economy.
Conflict in the Middle East has disrupted oil flows through the Strait of Hormuz this year, with shut-ins of Gulf crude peaking in May, according to EIA estimates. Brent crude averaged about US$96 a barrel in the third quarter, against US$69 in the same quarter of 2025, with September alone averaging US$114. Strip energy out, and Canada's inflation problem largely disappears and the euro area's shrinks to a modest overshoot. In the United States, it does not: underlying inflation there is well above target in its own right.
That matters because textbook monetary policy treats a supply shock very differently from inflation driven by too much spending. Interest rates cannot pump more oil. They work by cooling demand, and they take a year or more to do it.
Start with how much of today's inflation is energy. Eurostat's breakdown is the clearest. Of the euro area's 3.8% inflation rate in September, energy alone contributed 1.71 percentage points, about 45% of the total, with energy prices up 18.9% on a year earlier. Services, the part of the basket most tied to domestic wages, contributed 1.52 points, with services inflation at 3.2%. Food and other goods added little. The ECB's preferred underlying measure, which excludes energy, food, alcohol and tobacco, was 2.5%, still above the 2% target.
In the United States, the energy index rose 20.4% over the year to September and petrol (gasoline) prices by 34.2%. But underlying inflation is not low. On the Fed's preferred measure, core PCE prices rose 3.0% in the year to August, against 3.4% for all items, so energy and food explain only 0.4 points of the gap. The consumer price index's own core measure, at 2.6% in September, is unusually running below core PCE at present, so the choice of measure matters. The Fed targets PCE.
Canada shows the energy split most sharply: headline inflation of 3.1%, but only 2.2% once petrol is excluded, and 1.8% to 1.9% on the Bank of Canada's two preferred core measures, CPI-trim and CPI-median. The Bank of Canada also judges that its economy still has excess supply. For a primer on how these measures are built and why central banks watch them, see our Study guide on understanding inflation.
Not every economy fits this pattern, and the exceptions are instructive. Japan is tightening for a different reason. When the Bank of Japan raised its policy rate to around 1.25% on 18th September, it pointed to underlying inflation steadily approaching its 2% target, a tight labour market, firms passing wage increases on to prices, and rising medium- to long-term inflation expectations. That is the classic case for raising rates: inflation that is becoming self-sustaining at home, not a price spike imported through the oil market. Even so, the decision split the board 7–2, with two members arguing that price developments had not yet clearly accelerated.
The central banks themselves are not ignoring the energy split. The ECB, in its September decision, explicitly noted that wages have so far shown no material response to the energy shock and that most measures of longer-term inflation expectations remain around 2%. Its own staff expect energy inflation to turn negative and stay there until mid-2028, pulling headline inflation down from 3.0% this year to 2.1% in 2028. Yet it raised rates anyway, for a reason worth taking seriously. The longer energy prices stay high, the ECB argued, the more likely they are to seep into everything else, through transport costs, firms' pricing and wage demands.
The Fed's September statement described inflation as still elevated and presented its quarter-point increase as a way to return to 2% sooner. It also described the economy as expanding at a solid pace, and the median Fed policymaker projects growth of 2.3% this year. Policymakers also pencilled in one more quarter-point move before the end of this year. For the background to that decision, see our report on the Fed's September hike.
EconoLens Analysis
Three calculations change how the coming week looks, and they point in different directions for different economies.
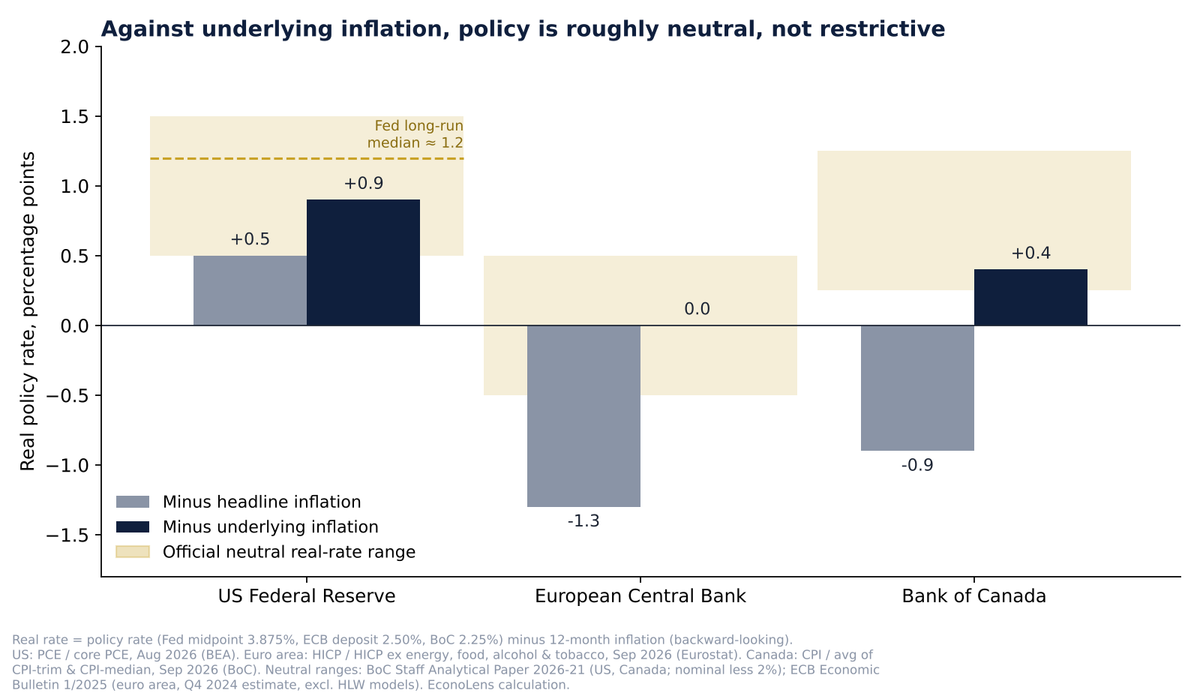
The first is the real interest rate: the policy rate minus inflation. Strictly, what matters is the policy rate minus expected inflation. The simple backward-looking version used here is a gauge of how tight policy is, not a precise measure. Measured against headline inflation, policy looks loose almost everywhere. The ECB's deposit rate is 1.3 points below euro-area inflation, and the Bank of Canada's rate is about 0.9 points below Canadian inflation. On that reading, more hikes look obviously justified.
But headline inflation is the wrong yardstick for a supply shock that is expected to reverse. Measured against the underlying inflation each bank says it watches, the picture flips (see the chart below). The ECB's real rate is roughly zero, inside the −0.5% to +0.5% range ECB staff estimated for the neutral real rate (an estimate based on data to late 2024, so somewhat dated). The Bank of Canada's is about +0.4 points, at the low end of the 0.25% to 1.25% real range implied by its staff's 2026 neutral-rate estimate.
The Fed's, at the midpoint of its range against core PCE inflation of 3.0%, is about +0.9 points. That is below the roughly 1.2% implied by Fed policymakers' long-run rate projection of 3.2%. Measured against the 3.4% core PCE rate they project for the end of this year, it is only about +0.5. In plain terms, policy is roughly neutral in all three economies once energy is set aside. It is not restrictive anywhere, and in the US it is slightly on the easy side of neutral.
The second is a simple rule-of-thumb check. A Taylor-type rule sets the policy rate at the neutral real rate, plus underlying inflation, plus half of inflation's gap from target. It is a benchmark, not a forecast, and the version here ignores spare capacity. On that rule, the US policy rate would be about 4.7%, roughly 80 basis points above today's midpoint. The euro area's would be about 2.75%, one quarter-point above the current deposit rate. Canada's would be about 2.5%, a quarter-point or so above today's rate. Allowing for the excess supply the Bank of Canada reports would pull Canada's figure lower. On inflation alone, then, the US is the economy where the case for tighter policy is strongest, not weakest.
The third calculation is about timing. Monetary policy works with long lags; central banks' own estimates commonly put the bulk of a rate change reaching inflation after one to two years. So the right question for a decision taken in October 2026 is what energy prices will be doing in late 2027.
On the US Energy Information Administration's October forecast, Brent averages about US$105 in the final quarter of this year, 65% above a year earlier, before falling to US$87 by mid-2027 and US$74 by the end of 2027. That turns oil from the biggest source of inflation into a drag. By our calculation from the EIA's quarterly path, oil prices would be about 16% below year-earlier levels in mid-2027 and about 29% below by the fourth quarter. Even then, US$74 would still be above the 2025 average of US$69. The price level stays higher, but its rate of change turns negative.
A hike delivered now would therefore bite hardest at roughly the moment energy is already pulling inflation down. That raises the risk of tightening more than needed, with growth weaker than necessary. The ECB's own staff already expect headline inflation to be back at 2.1% in 2028, close to target without further tightening.
Two caveats apply. First, rate decisions also work faster, through expectations: a hike can steady wage and price-setting behaviour long before it cools demand. Second, the EIA's path assumes Gulf supply gradually recovers, and the agency itself warns of continued volatility.
Our conclusion therefore differs by economy.
Canada has the weakest case for further tightening. Underlying inflation is below 2%, the central bank reports spare capacity, and policy is at the low end of neutral. There is one warning light. In the Bank of Canada's third-quarter consumer survey, five-year-ahead inflation expectations rose to 3.9%, matching short-term expectations. Consumers named energy and trade tensions as the reasons.
The euro area sits in between. Energy accounts for about 45% of inflation and most of the overshoot above 2%, and longer-term expectations are near 2%, according to the ECB. But underlying inflation is 2.5% and projected to edge up to 2.6% next year, and policy is only around neutral. That supports at most a modest further step, not a sustained series of hikes.
The United States is where the energy argument carries least weight. Underlying inflation is a full point above target, and policy is slightly below the Fed's own neutral estimate. The case for holding there rests on a different footing: a cooling labour market. Payrolls rose by just 29,000 in September, unemployment is 4.2%, and average hourly earnings are up 3.0% on a year earlier, slower than prices. That is not the profile of a wage-price spiral.
Households' one-year inflation expectations jumped to 3.9% in September, the highest since May 2023, in the New York Fed's survey. But five-year expectations held at 3.0%, and expected earnings growth fell to 2.6%.
In each economy, the decisive evidence is wages and medium-term expectations, not headline inflation. That is the test central banks burned by calling the 2021–22 surge "transitory" will be applying. For a fuller treatment of how policy rates pass through to the economy, see our Study guide on how monetary policy works.
Where economists reviewing the same data disagree
The disagreement is genuine and runs along three lines.
The first concerns how temporary the shock really is. Economists who favour "looking through" energy spikes point to the official forecasts above: EIA expects most Middle East oil production to recover by mid-2027, and the ECB expects energy prices to fall. The other side notes that the 2021–22 inflation surge was also first expected to fade quickly, and did not. Supply routes through the Gulf remain constrained, global oil inventories are still being drawn down, and Brent's daily peak of US$131 a barrel on 15th September followed attacks on a key Saudi bypass pipeline. A shock that keeps getting renewed stops being a one-off.
The second line is about second-round effects. Here the evidence is mixed rather than one-sided. Long-term inflation expectations in the euro area remain near 2%, and wage growth has not jumped. But services inflation in the euro area has edged up from 3.0% to 3.2%, the ECB's wage tracker points to negotiated wage growth rising to 2.7% in the first half of 2027, and ECB staff project underlying inflation to tick up to 2.6% next year rather than fall.
In the US, Fed policymakers expect core PCE inflation to end 2026 at 3.4%, above August's 3.0%. In Canada, consumers' long-term expectations have risen. If those projections are right, part of the energy shock is already turning into broader inflation, and the hawks have a stronger case than the snapshot of real rates suggests.
The third concerns the cost of being wrong. Under-tightening risks entrenched inflation, which is costly and slow to reverse, as 2022–23 showed. Over-tightening risks an unnecessary slowdown at a time when public debt is high and rising borrowing costs are already straining government budgets, a channel we examined in our analysis of the IMF's October Fiscal Monitor. Which mistake is worse depends on how firmly anchored expectations are, and that is exactly where reasonable economists differ.
What this means for policymakers, businesses and households
For central banks, the evidence is most consistent with a hold at the Bank of Canada and a hold with a tightening bias at the ECB. For the Fed, it is a close call between holding because of the labour market and tightening because of underlying inflation. In none of the three does the case rest on a pre-committed series of hikes.
The useful signals to watch are wage settlements, services inflation and survey measures of medium-term expectations. If those move up, tightening becomes justified regardless of the oil price. If they stay put, further hikes risk fighting a shock that is already forecast to fade.
For governments, the IMF's advice applies directly. Broad fuel subsidies and price caps keep demand for scarce energy high and add to budget deficits. Support targeted at lower-income households and kept temporary protects those hit hardest without working against monetary policy.
For businesses, the practical message is that borrowing costs are likely to stay higher for longer than seemed plausible a year ago, even if rates do not rise much further. Fed policymakers' median projection, for example, has no cut in 2027. Investment plans that assumed rate cuts in 2027 should be stress-tested against flat rates. Energy-intensive firms face the opposite timing risk: if EIA's forecast is right, input costs could fall sharply through 2027.
For households, real incomes are being squeezed now by fuel and transport costs. In the US, pay is rising more slowly than prices. The more durable risk is not the current spike but a policy overshoot that slows hiring later. Both are worth watching in the months after super week.
Facts, interpretation and projections in this piece
- Verified facts (official releases): inflation rates, energy contributions and policy rates, from the BLS, BEA, Eurostat, Statistics Canada, the Bank of Canada, the Federal Reserve, the ECB and the Bank of Japan; past Brent prices from the EIA; US payrolls and earnings (BLS); consumer inflation expectations (New York Fed, Bank of Canada).
- Projections and estimates (not outcomes): EIA's Brent path for 4Q26–4Q27; ECB staff inflation and growth projections; Fed policymakers' median projections; official neutral-rate estimates, which are model-based ranges with wide uncertainty.
- EconoLens interpretation: the real-rate comparison, the rule-of-thumb check, the timing argument and the country-by-country conclusions.
The data and the working
| Central bank | Policy rate | Headline inflation | Underlying inflation | Real rate vs headline | Real rate vs underlying | Neutral real-rate range |
|---|---|---|---|---|---|---|
| US Federal Reserve | 3.875% (midpoint of 3.75–4.00%) | 3.4% (PCE; Aug) | 3.0% (core PCE; Aug) | +0.5 | +0.9 (+0.5 vs projected 3.4% core) | about 1.2 (Fed long-run median 3.2% less 2%); 0.5 to 1.5 (BoC staff estimate for US) |
| European Central Bank | 2.50% (deposit rate) | 3.8% (HICP; Sep) | 2.5% (ex energy/food/alcohol/tobacco; Sep) | −1.3 | 0.0 | −0.5 to +0.5 (ECB staff; Q4 2024 data) |
| Bank of Canada | 2.25% | 3.1% (CPI; Sep) | 1.85% (average of CPI-trim 1.8% and CPI-median 1.9%; Sep) | −0.9 | +0.4 | 0.25 to 1.25 (BoC staff 2026: nominal 2.25–3.25% less 2%) |
Rule-of-thumb (Taylor-type) check, illustrative only: i = r* + π + 0.5 × (π − 2), using underlying inflation for π and the midpoint of each official neutral range for r*. Spare capacity is ignored.
| Economy | r* | π (underlying) | Implied rate | Actual rate | Gap |
|---|---|---|---|---|---|
| United States | 1.2 | 3.0 | 1.2 + 3.0 + 0.5 = 4.7% | 3.875% | +0.8 |
| Euro area | 0.0 | 2.5 | 0.0 + 2.5 + 0.25 = 2.75% | 2.50% | +0.25 |
| Canada | 0.75 | 1.85 | 0.75 + 1.85 − 0.075 ≈ 2.5% | 2.25% | +0.3 (lower once spare capacity is allowed for) |
| Indicator | United States | Canada | Euro area |
|---|---|---|---|
| Wage growth | Average hourly earnings +3.0% y/y (Sep; BLS) | Consumers' expected wage growth 2.9% (BoC survey; Q3) | Negotiated wages projected to rise to 2.7% in H1 2027 (ECB wage tracker) |
| Labour market | Payrolls +29000; unemployment 4.2% (Sep; BLS) | Excess supply in the economy (BoC; 2 Sep) | — |
| Short-term consumer inflation expectations | 1-year 3.9% (Sep; NY Fed) | 1-year 4.0% (Q3; BoC) | Elevated (ECB; Sep) |
| Medium/long-term consumer inflation expectations | 3-year 3.3%; 5-year 3.0% unchanged (NY Fed) | 5-year 3.9% and rising (BoC) | Most longer-term measures around 2% (ECB) |
How much of euro-area inflation is energy: Eurostat reports energy's contribution as 1.71 points of the 3.8% total (1.71 ÷ 3.8 = 45%), with energy prices up 18.9%. That implies an energy weight of about 1.71 ÷ 18.9 = 9.0% of the basket (an approximation backed out of published contributions). Inflation in the remaining 91% of the basket is therefore about (3.8 − 1.71) ÷ (1 − 0.090) = 2.3%.
| Quarter | Brent (US$/b) | Year-on-year change | Status |
|---|---|---|---|
| 1Q26 | 81.11 | +7.0% | Outturn |
| 2Q26 | 102.93 | +51.3% | Outturn |
| 3Q26 | 95.95 | +39.1% | Outturn (includes EIA's September estimate) |
| 4Q26 | 104.69 | +64.5% | EIA forecast |
| 1Q27 | 94.90 | +17.0% | EIA forecast |
| 2Q27 | 87.00 | −15.5% | EIA forecast |
| 3Q27 | 80.03 | −16.6% | EIA forecast |
| 4Q27 | 73.94 | −29.4% | EIA forecast |
What to watch from here: the statements and press conferences of 28–30 October, more than the decisions themselves. The tell will be whether central banks frame further moves around wages and expectations or around headline inflation. The US personal income and outlays release on 29 October brings September PCE inflation, and the Bank of Canada's Monetary Policy Report and the Bank of Japan's Outlook Report will update their inflation projections. Live policy-rate and inflation series for the US, euro area and UK are tracked on the EconoLens Indicators dashboard. For the run-up in euro-area energy prices over the summer, see our report on August euro-area inflation.
Frequently Asked Questions
When do the Fed, ECB, Bank of Japan and Bank of Canada meet in October 2026?
The Bank of Canada and the US Federal Reserve announce decisions on 28 October 2026, the European Central Bank on 29 October and the Bank of Japan on 30 October, after its 29–30 October meeting.
Why is inflation rising again in 2026?
Energy is the common driver. Middle East supply disruption pushed Brent crude to an average of about US$114 a barrel in September 2026, and energy prices were up 20.4% on a year earlier in the US and 18.9% in the euro area. But its weight differs. Energy explains nearly all of Canada's overshoot and about 45% of euro-area inflation. In the US, underlying inflation (core PCE 3.0%) is itself well above the 2% target.
Should central banks raise interest rates in response to an oil price shock?
Standard theory says central banks should usually look through a temporary supply shock, because rates cannot increase oil supply and act with a lag. They should tighten if the shock starts to raise wage growth and longer-term inflation expectations, or if underlying inflation is already above target for other reasons.
What is a real interest rate?
It is the policy interest rate minus inflation, ideally expected inflation. It shows how tight monetary policy really is. A real rate below the neutral level stimulates demand; a rate above it restrains demand.
What is the oil price forecast for 2027?
The US Energy Information Administration's October 2026 outlook forecasts Brent crude at about US$84 a barrel on average in 2027, falling to about US$74 by the fourth quarter, as Middle East production gradually recovers. The EIA cautions that prices are likely to remain volatile.
Primary Sources
Cite This Article
Khagan Rao. (2026, October 23). Hiking Into an Oil Shock: Where the Case for Higher Rates Holds, and Where It Doesn't. EconoLens. https://www.econolens.co.in/news/central-bank-super-week-october-2026-oil-shock-rate-hikes
Khagan Rao is an economist and analyst specialising in global monetary policy, fiscal frameworks, and international trade. He tracks publications from the IMF, World Bank, BIS, and RBI to deliver accessible, data-driven analysis for a global audience.