The World's Debt Problem Has Become an Interest-Rate Problem: Reading the IMF's October 2026 Fiscal Warning
- ▸The IMF's October 2026 Fiscal Monitor, released on 14th October at the Annual Meetings in Bangkok, keeps global public debt, just under 94% of world GDP in 2025, on track to pass 100% by the end of the decade, with the fiscal outlook worsening for a second straight year.
- ▸The United States is the biggest single driver: the IMF projects its general government deficit at 8.5% of GDP this year and its debt climbing to 145% of GDP by 2031, while the US federal deficit for fiscal year 2026 came in at about US$2.0 trillion.
- ▸EconoLens analysis: at today's debt levels, a lasting one-point rise in the gap between interest rates and growth (r − g) eventually adds about 0.9% of GDP to debt every year, once it has worked through the debt stock. That is more than twice this year's fiscal slippage, so the path of interest rates now matters more than the next budget.
Reviewed by: EconoLens Economics Desk
For most of the past fifteen years, governments could borrow heavily without being punished for it. Interest rates sat below the pace at which their economies grew, so debt measured against national income tended to shrink on its own. The International Monetary Fund's latest Fiscal Monitor, published on 14th October 2026 during the IMF–World Bank Annual Meetings in Bangkok, is in effect a notice that this era is over. The Fund estimates that public debt worldwide stood at just under 94% of world GDP in 2025 and will pass 100% by the end of the decade. On the Fund's latest projections, the ratio reaches 98.9% in 2029 and 100.3% in 2030. By the IMF's own historical comparison, that would be the heaviest public debt load since the late 1940s. Growth has held up better than expected, yet the Fund's forecast for the global primary balance (the budget balance before interest) is about 0.4% of GDP worse than it was six months ago. That is a slippage of the same size as last year's outcome. The Fund's fiscal chief, Rodrigo Valdés, framed the problem as rising risk without a matching response. Debt is high and still climbing, borrowing costs have gone up, and spending pressure is coming from every direction. His advice to the most exposed governments was to start adjusting now, before bond markets force a harsher correction on them.
Reading the report as economists, we think the headline number is not the most important finding. The more important shift is in what drives debt, a point the IMF itself flagged in Bangkok by showing the gap between interest rates and growth narrowing across both advanced and emerging economies. Ten years ago the debt question was mostly about deficits: how much governments spent beyond what they collected. In 2026 it is increasingly about the price of money. That changes who holds the levers. Finance ministries still write budgets, but central banks and bond markets now shape the debt arithmetic at least as much. The Fund described that shift; our analysis below tries to put a number on it.
Start with the backdrop the Fund itself painted a day earlier. Its October 2026 World Economic Outlook, titled Resilience Under Strain, Urgent Choices, expects the world economy to grow 3.1% this year and 3.4% in 2027. Inflation is the less comfortable part: the IMF projects global headline inflation at 4.7% in 2026, pushed up by energy and food prices linked to the Middle East conflict, easing only to 4.1% next year. That combination is why the Fund's fiscal advice this time is unusually blunt. With prices already rising too fast, extra government spending would add to demand pressure at exactly the wrong moment. The IMF's message is that fiscal policy should be restrained, not expanded, and that there is no general case for new support packages.
The sharpest example is energy. Many governments responded to this year's oil and gas shock with broad subsidies and price caps. The Fund estimates that these price-suppression measures, taken together, cost about 0.5% of global GDP. For a typical country that kept fuel prices fully fixed after the shock, it puts this year's cost at 1% to 1.5% of GDP. Its objection is not only the cost. Capping prices for everyone mutes the signal that should push households and firms to use less scarce fuel, which can keep world prices higher for longer and shift the burden onto countries that did not subsidise. The Fund's preferred design is support that is targeted at people who need it most, limited in size, temporary, and transparent in the budget. Put simply: help the vulnerable, and let prices do their job for everyone else.
The country that matters most for the global numbers is the United States. On the IMF's general government measure, which counts federal, state and local budgets together, the US deficit is projected at 8.5% of GDP in 2026, up from 7.1% in 2025. Gross general government debt is put at 126.8% of GDP this year, rising to 145.0% by 2031, higher than the 142.1% the Fund projected for the same year only six months ago. Washington's own accounts point the same way. The Congressional Budget Office's review of fiscal year 2026, which ended on 30th September, puts the federal deficit at about US$2.0 trillion, $218 billion more than the year before. Revenues grew by $169 billion (about 3%), while outlays grew by an estimated $386 billion (about 6%), with net interest on the debt among the line items pushing spending up. Among emerging markets, the other large contributor is China, whose general government deficit the IMF projects at about 8% of GDP in 2026, widening to 8.4% in 2027.
None of this was helped by monetary policy. The US Federal Reserve raised its policy rate to 3.75%–4.00% on 16th September, its first increase since 2023, and signalled more tightening ahead. A higher policy rate feeds through to the yields governments pay when they roll over maturing debt. That is the channel the September 2026 market sell-off exposed, and it is the channel the Fund is most worried about. IMF staff noted at the briefing that G7 government bond yields have risen by about 120 basis points since the end of February. The Fund expects borrowing costs to exceed growth rates in a growing number of countries. When that happens, debt ratios rise even if a government's budget, before interest, is balanced. For readers who want the mechanics of how policy rates reach long-term borrowing costs, our Study guide on how monetary policy works walks through the transmission chain.
EconoLens Analysis
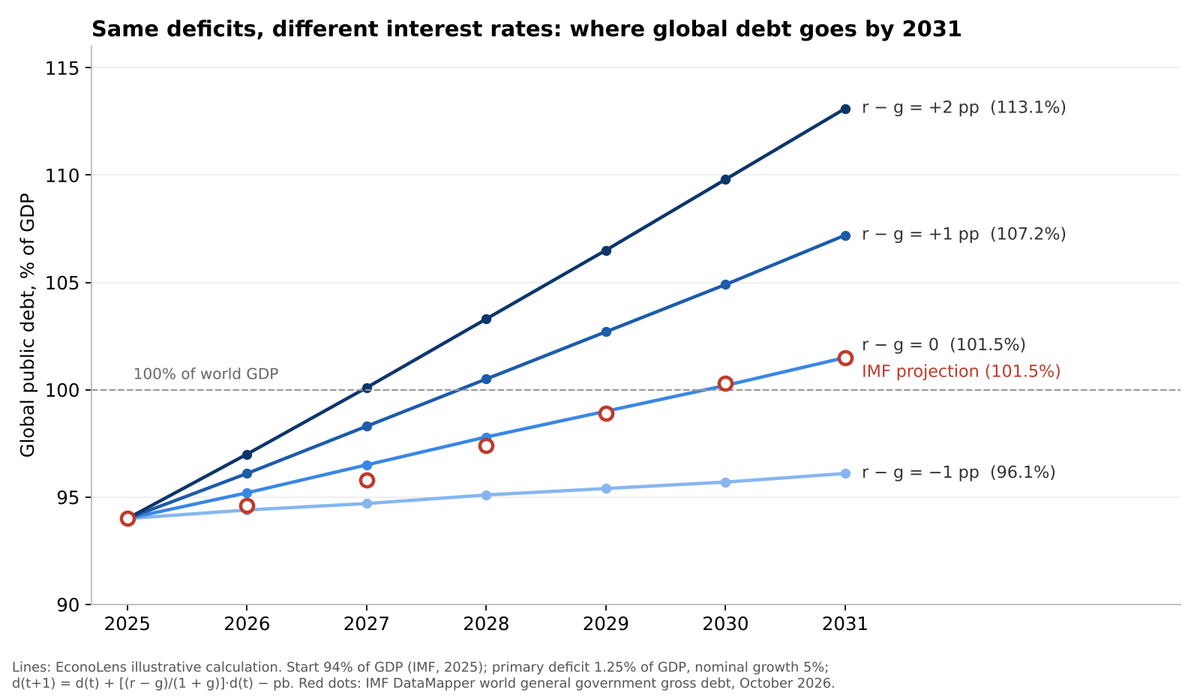
The standard way to see why interest rates now dominate is the debt-dynamics identity economists use for sustainability work. The change in the debt ratio each year equals the interest-growth gap multiplied by the existing debt stock, minus the primary balance (the budget balance excluding interest). Two things follow. First, the higher the debt stock, the more a given change in interest rates matters. Second, a government can only hold its debt ratio steady by running a primary surplus big enough to offset the interest-growth gap. We applied that identity to the IMF's own starting point. At a global debt ratio of 94% and nominal growth of around 5%, every lasting one-percentage-point rise in r − g adds about 0.9% of GDP to the debt ratio every year. For the United States, starting from 126.8%, the same one point adds about 1.2% of GDP a year. One caveat matters here. The "r" in the identity is the average rate on all outstanding debt, not today's market yield, and it rises only as old bonds mature and are refinanced at new rates. A rise in yields therefore phases in over several years rather than hitting the budget at once, a point the IMF itself stressed in Bangkok. Once it has passed through, the comparison is stark. This year's global fiscal slippage of 0.4% of GDP is what the IMF treats as a warning sign. A sustained one-point rise in borrowing costs relative to growth, fully passed through, does more than twice as much damage every year. Our scenarios (chart below) start from the same deficits each time. Debt by 2031 ends anywhere from 96% of world GDP, if rates stay one point below growth, to 113%, if they settle two points above it. The scenario that reproduces the IMF's own debt path (101.5% in 2031) is the one where interest rates and growth roughly cancel out. So the baseline quietly assumes that the post-2022 rise in yields does not go any further.
There is also a less obvious point in the timing. The IMF wants inflation to fall from 4.7% to 4.1% next year, and for households that is good news. For debt arithmetic, it is not. Nominal growth, the "g" in the identity, includes inflation. If inflation slows by six-tenths of a point while bond yields stay where they are, r − g widens by roughly the same amount, even though nothing has changed in any budget. Disinflation with sticky long-term yields is the setting in which debt ratios climb fastest. That is why, in our view, the next twelve months are a more dangerous fiscal window than the inflation peak itself.
Where economists reviewing the same report disagree
The Fund's diagnosis is not universally accepted, and the disagreements are substantive rather than political noise.
The first argument is over how alarming 100% really is. One school of thought, influential since the low-rate 2010s, holds that public debt is costly mainly when interest rates exceed growth. On this view, a debt ratio is a weak guide on its own, and what matters is the interest-growth gap and whether markets keep funding governments at reasonable rates. Economists in this camp point out that several advanced economies have carried debt above 100% of GDP for decades without a funding crisis. The IMF's counter, which our scenario arithmetic supports, is that this argument was strongest when r − g was clearly negative. Its force weakens as the gap closes.
The second argument is about timing. The Fund wants adjustment to start now, especially where fiscal risks are highest. Critics worry that tightening budgets while central banks are also tightening could tip slower economies into recession. That would reduce "g" and make the ratios worse in the short run. The IMF's answer in this edition is to focus on how revenue is raised rather than simply raising more of it. Its analytical chapter, Taxing Better to Boost Growth, builds a new cross-country database of tax distortions. It estimates that moving a country from the 25th to the 75th percentile on that measure could raise GDP per person by about 3.5% within a few years. Major tax-administration reforms, it finds, have raised close to 2% of GDP in revenue. Simplifying VAT, removing exemptions and lightening compliance burdens on small and young firms are among the measures it highlights. Whether those gains arrive fast enough to matter for an end-of-decade debt path is an open question.
The third argument is about forecasts. Debt projections running to 2031 rest on assumptions about growth, interest rates and future policy, and reasonable economists contest each of them. Sceptics of the IMF's numbers, including some US policymakers, argue that the Fund's long-range fiscal forecasts have an uneven record. They also argue that new revenue sources, such as tariff receipts, are not fully captured. The evidence since April has gone the other way, though. The Fund has revised its 2031 US debt projection upward, from 142.1% to 145.0% of GDP, not downward, and Washington's own fiscal-year outturn showed the deficit widening.
The fourth argument concerns artificial intelligence. If the current wave of AI investment produces a lasting productivity gain, "g" rises and much of the debt problem eases without painful adjustment. The IMF lists stronger AI-driven productivity among its upside risks. It also lists the opposite case, a sharp reassessment of AI returns that tightens financial conditions, among its main downside risks. A fiscal strategy that depends on the optimistic case is a bet, not a plan.
The data and the working
The identity behind our analysis, for readers who want to check it:
Setting the left-hand side to zero gives the primary balance needed to hold debt steady:
Plugging in the numbers used above (g = 5%):
| Debt ratio | r − g = −1 pp | r − g = 0 | r − g = +1 pp | r − g = +2 pp |
|---|---|---|---|---|
| World (debt 94% of GDP) | -0.9 | 0.0 | 0.9 | 1.8 |
| United States (debt 126.8% of GDP) | -1.2 | 0.0 | 1.2 | 2.4 |
For the scenario chart, we held the global primary deficit at 1.25% of GDP and nominal growth at 5% throughout, and varied only r − g. To keep the chart simple, each path assumes the new r − g applies to the whole debt stock from 2026; in practice it phases in as debt is refinanced, so the gaps between paths open more gradually than shown. The 1.25% figure is not an IMF estimate. We calibrated it so that the r − g = 0 path tracks the IMF's own world debt projection (IMF DataMapper, October 2026). It lands exactly on the Fund's 101.5% in 2031 (94 + 6 × 1.25 = 101.5) and stays within 0.7 points of the Fund's path in every year. The paths are illustrative and show sensitivity to interest rates. They are not a forecast.
| Year | r − g = −1 pp | r − g = 0 | r − g = +1 pp | r − g = +2 pp | IMF projection |
|---|---|---|---|---|---|
| 2025 | 94.0 | 94.0 | 94.0 | 94.0 | 94.0 |
| 2026 | 94.4 | 95.2 | 96.1 | 97.0 | 94.6 |
| 2027 | 94.7 | 96.5 | 98.3 | 100.1 | 95.8 |
| 2028 | 95.1 | 97.8 | 100.5 | 103.3 | 97.4 |
| 2029 | 95.4 | 99.0 | 102.7 | 106.5 | 98.9 |
| 2030 | 95.7 | 100.2 | 104.9 | 109.8 | 100.3 |
| 2031 | 96.1 | 101.5 | 107.2 | 113.1 | 101.5 |
View data
| Series | Date | Value |
|---|---|---|
| US Fed funds target rate (upper bound) | 2025-12-10 | 3.75% |
| US Fed funds target rate (upper bound) | 2026-01-28 | 3.75% |
| US Fed funds target rate (upper bound) | 2026-03-18 | 3.75% |
| US Fed funds target rate (upper bound) | 2026-06-17 | 3.75% |
| US Fed funds target rate (upper bound) | 2026-07-29 | 3.75% |
| US Fed funds target rate (upper bound) | 2026-09-16 | 4.00% |
What to watch from here: the yield governments pay when they refinance, more than the next round of budget headlines. Three things will show whether the IMF's baseline holds. The first is whether long-term government bond yields in the largest economies settle or keep rising after the Fed's September move. The second is whether inflation falls faster than those yields, which would widen r − g even with unchanged budgets. The third is whether energy support schemes are wound down or quietly made permanent. Live US, euro-area and UK policy-rate and inflation series are tracked on the EconoLens Indicators dashboard. For the pressure points among more fragile borrowers, see our earlier analysis of which economies face sovereign debt crisis risk.
Frequently Asked Questions
How high is global public debt in 2026?
The IMF estimates global public debt at just under 94% of world GDP in 2025 and projects it to pass 100% of world GDP by the end of the decade (100.3% in 2030 on its October 2026 projections).
What does "r minus g" mean in debt sustainability?
It is the gap between the average interest rate a government pays on its debt (r) and the nominal growth rate of its economy (g). When r exceeds g, the debt-to-GDP ratio rises unless the government runs a primary surplus large enough to offset the gap.
Why does falling inflation make government debt harder to manage?
Nominal GDP growth includes inflation, so slower inflation lowers g. If bond yields do not fall by the same amount, the interest-growth gap widens and debt ratios rise faster, even with unchanged budgets.
What did the IMF recommend in its October 2026 Fiscal Monitor?
The IMF advised governments with the highest fiscal risks to begin adjusting now, avoid broad new support while inflation is elevated, keep any energy relief targeted, temporary and transparent, and redesign taxes to support growth without losing revenue.
How large is the US budget deficit in 2026?
The US federal deficit for fiscal year 2026 was about US$2.0 trillion, according to the Congressional Budget Office. On the IMF's broader general government measure, the 2026 US deficit is projected at 8.5% of GDP.
Primary Sources
Cite This Article
Khagan Rao. (2026, October 22). The World's Debt Problem Has Become an Interest-Rate Problem: Reading the IMF's October 2026 Fiscal Warning. EconoLens. https://www.econolens.co.in/news/imf-fiscal-monitor-october-2026-global-debt-100-percent-interest-rates
Khagan Rao is an economist and analyst specialising in global monetary policy, fiscal frameworks, and international trade. He tracks publications from the IMF, World Bank, BIS, and RBI to deliver accessible, data-driven analysis for a global audience.