China's Factory Prices Rise 5.7% While Consumer Prices Rise 0.7%: A Narrow Shock, Not a Broad Demand Recovery
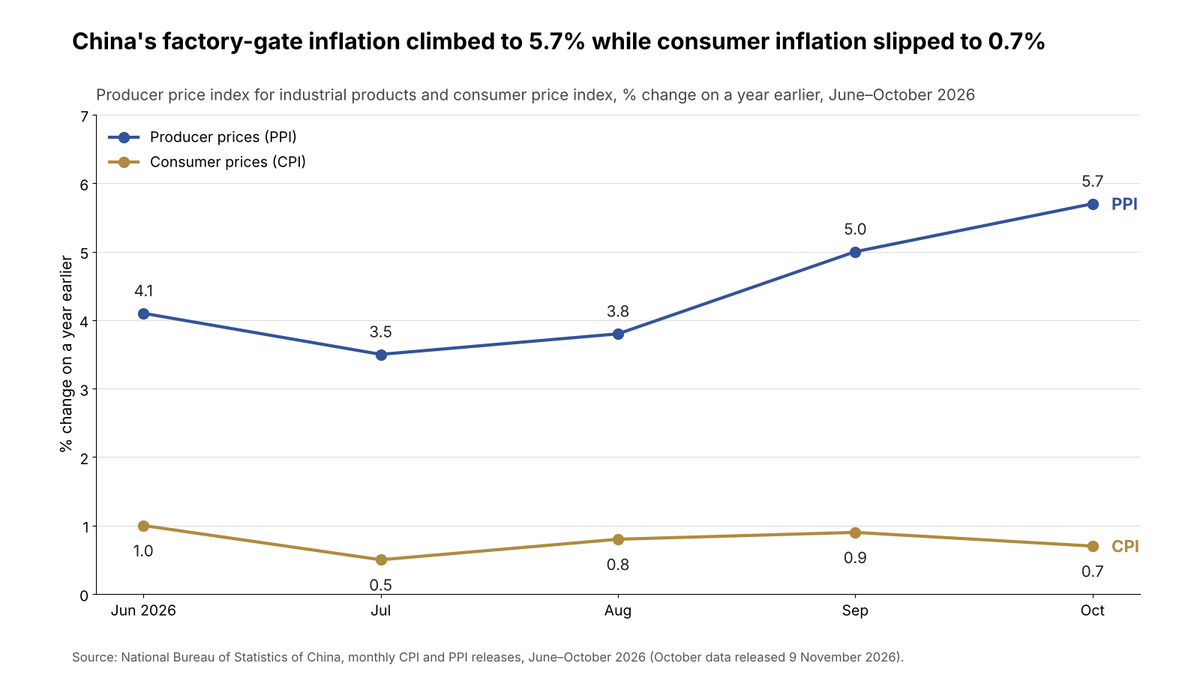
- ▸China's producer price index (PPI) rose 5.7% in October 2026 from a year earlier, the fastest pace since June 2022, while consumer prices rose 0.7% and core consumer prices 0.8%, the National Bureau of Statistics (NBS) reported on 9 November 2026.
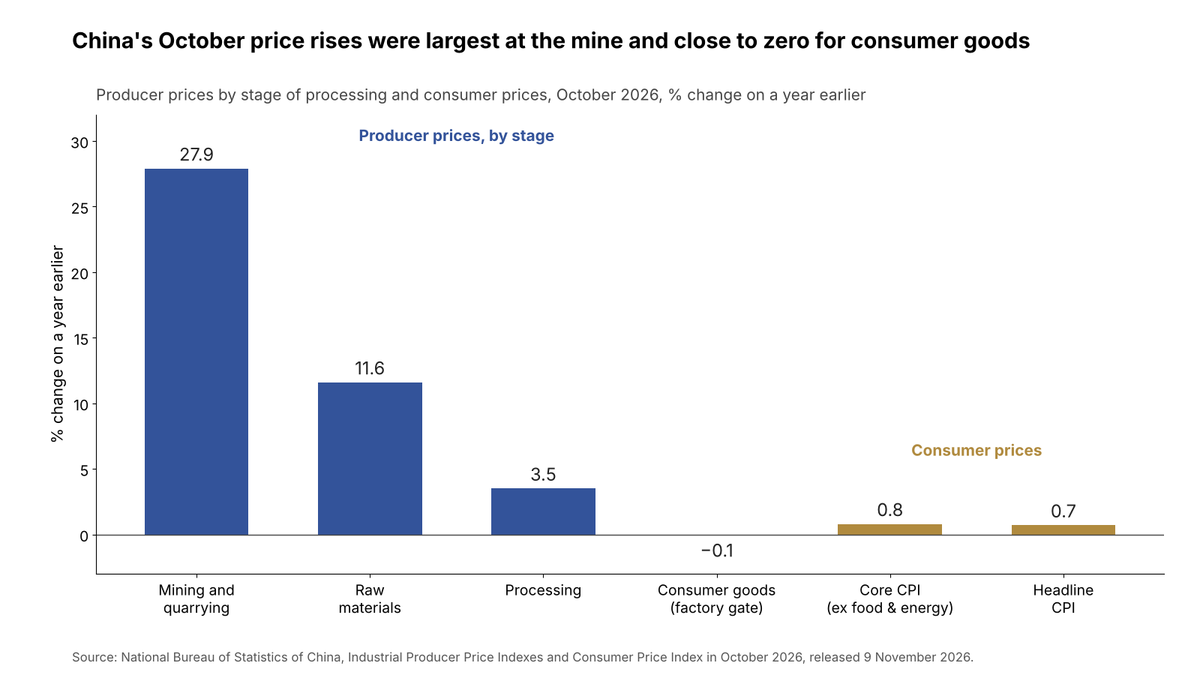
- ▸Prices rose most at the start of the supply chain: mining and quarrying +27.9%, raw materials +11.6%, processing +3.5%, and factory-gate consumer goods −0.1%. Retail sales were 0.4% higher than a year earlier and fixed-asset investment fell 8.1% in January–October.
- ▸EconoLens analysis: nine industries, centred on energy, chemicals, metals and electronics, added about 6.1 percentage points to the 5.7% PPI rise, so the rest of industry subtracted about 0.4 points. China's producer price rise is a narrow cost and technology shock, not evidence that weak domestic demand has recovered.
China is seeing two different inflation rates. At the factory gate, prices in October 2026 were 5.7% higher than a year earlier, the fastest rise since June 2022. In the shops, prices were up only 0.7%. The gap of 5.0 percentage points between the two measures was the widest in the five months shown in Figure 1.
Until recently, China's producer prices were falling. NBS figures show year-on-year declines of 5.4% in June 2023, 0.8% in June 2024 and 3.6% in June 2025, and producer prices were still 2.1% lower in October 2025 than a year before. The swing since then is large, and it matters to the rest of the world, because China sells a large share of the world's manufactured goods and industrial inputs.
The question this article addresses is whether the jump in producer prices shows Chinese demand recovering, or whether it is a cost shock concentrated in a few industries.
What the figures show
The NBS publishes two producer price measures. The PPI tracks the prices industrial firms receive when they first sell their products. The purchasing price index tracks what they pay for their inputs.
| China, prices, % change on a year earlier | September 2026 | October 2026 |
|---|---|---|
| Producer prices (PPI) | 5.0 | 5.7 |
| Purchasing prices for industrial producers | 6.9 | 7.9 |
| Consumer prices (CPI) | 0.9 | 0.7 |
| Core CPI (excluding food and energy) | 1.0 | 0.8 |
| CPI, food | −1.7 | −2.9 |
On the month, producer prices rose 0.7% in October, after 1.2% in September. Consumer prices were unchanged on the month.
Where the price rise is
The rise is largest at the start of the supply chain and smallest near the consumer. Prices of mining and quarrying products were 27.9% higher than a year earlier, raw materials 11.6% and processed goods 3.5%. Factory-gate prices of consumer goods were 0.1% lower.
The industry detail shows which products drove the rise. Producer prices rose 36.6% in coal mining, 35.0% in oil and gas extraction and 29.9% in petroleum and coal processing. Chemical raw materials rose 16.4%, non-ferrous metal smelting 18.6% and computers, communication and electronic equipment 5.9%.
The NBS attributes the month's rise mainly to higher international energy prices passing through to domestic energy products, and to demand for coal and gas before the winter heating season. Six energy and chemical industries contributed about 0.61 points of October's 0.7% monthly rise. The NBS also cites capacity management in some industries and demand linked to artificial intelligence (AI).
Consumer prices tell a similar story at the till. Gasoline prices were 22.4% higher than a year earlier and added about 0.63 points to the 0.7% CPI rise. Food prices fell 2.9%, led by fresh vegetables (−16.9%) and pork (−8.6%), and subtracted about 0.49 points.
Electronics stand out inside core prices. Data storage devices were 45.4% dearer than a year earlier, tablets 29.3%, computers 23.0% and mobile phones 16.7%. Together they added about 0.26 points to CPI. Industrial consumer goods excluding energy added about 0.30 points, so other non-energy goods added about 0.04 points.
Is demand recovering?
The activity data the NBS published on 16 November 2026 do not show a broad recovery in spending. Retail sales of consumer goods were 0.4% higher in October than a year earlier, in nominal terms. With consumer goods prices up 0.8%, retail sales volumes were roughly 0.4% lower, an EconoLens approximation.
Investment is falling. Fixed-asset investment was 8.1% lower in January–October than a year earlier. Investment in real estate development fell 21.6%, in infrastructure 5.1% and in manufacturing 2.9%. The official manufacturing purchasing managers' index (PMI) was 49.3 in October; a reading below 50 indicates contraction.
Trade is the exception. Exports in yuan were 28.7% higher than in October 2025 and imports 34.7% higher. A low base explains little of it: exports in October 2025 had fallen only 0.8%, so export values were still about 28% higher than two years earlier. Part of the rise may be higher prices rather than volumes, but the NBS release does not separate the two.
The NBS's own assessment, published with the data, describes domestic demand as weak relative to strong supply and calls the gap acute.
EconoLens Analysis: a narrow cost and technology shock, not a broad demand recovery
China's 5.7% producer price inflation is concentrated in a few industries hit by energy costs or riding the AI hardware cycle. It does not show the broad pricing power that a recovery in domestic demand would bring. The NBS's own breakdown makes the case.
The NBS names nine industries that pushed the PPI up in October: coal mining, oil and gas extraction, petroleum and coal processing, chemical raw materials, gas supply, computers and electronics, non-ferrous metal mining, non-ferrous metal smelting and electrical machinery. Together they contributed about 6.14 percentage points, more than the whole 5.7% rise. The rest of industry therefore subtracted about 0.44 points: outside these nine industries, producer prices were on balance falling.
The consumer side looks similar. Gasoline accounts for about 0.63 of the 0.7 points of CPI inflation. Without it, consumer prices were close to flat. Part of that flatness reflects cheaper vegetables and pork, which owe more to supply than to demand, so the cleaner gauge is core inflation. It slowed to 0.8% in October from 1.0% in September, and dearer electronics account for a visible part of it.
The shock is squeezing industries that cannot pass on costs. Purchasing prices rose 7.9%, faster than the 5.7% rise in output prices. Electricity producers pay for coal, whose price rose 36.6%, but their own output prices fell 3.8%. In January–September, profits of electricity, heat, gas and water suppliers fell 14.3%, profits in automobiles 22.8% and in food processing 17.3%.
A two-year view supports the reading. Chaining the October 2025 and October 2026 rates gives a PPI only about 3.5% higher than in October 2024, about 1.7% a year. Monthly changes from April to October 2026 add up to about 3.5%. Producer prices were therefore roughly unchanged between October 2024 and March 2026, and the whole of the recent rise came in the seven months that followed.
The strongest evidence against this view is that not all of the rise is cost-push. Electronics prices are rising with demand linked to AI, which the NBS itself cites. Core consumer prices are still positive, at 0.8%. Industrial profits rose 15.5% in January–September. The profit gains are concentrated, though: mining profits rose 38.2% and electronics 103.8%, while utilities, cars and food processing fell. That pattern points to a narrow shock rather than broad demand.
The conclusion is therefore limited. It applies to domestic demand as a whole. It does not apply to electronics, where both prices and profits point to real demand.
Where the assessments disagree
The NBS presents part of the rise as a healthier pricing environment. In its October commentary, it links some of the monthly increase to orderly capacity management, which has improved the balance of supply and demand in some industries, and to AI-related demand. Factory-gate car prices were unchanged on the month in October after three monthly declines, and the five industries pulling the PPI down most subtracted about 0.60 points in total, 0.06 points less than in September. On that reading, part of the price rise reflects less destructive price competition, which would support profits and wages over time.
The International Monetary Fund (IMF) took a more cautious view of Chinese demand. Its press release concluding the Article IV consultation in February 2026 described private domestic demand in 2025 as lacklustre and expected deflationary pressures to persist. The Executive Board recommended more expansionary policy, focused on fiscal stimulus, "until deflationary pressures subside durably". That assessment predates the 2026 rise in energy prices, so it does not address a PPI of 5.7%.
The October data can support both readings. Producer prices are rising and some price wars have eased. But core consumer inflation slowed to 0.8%, retail volumes are falling and investment is contracting. A durable end to deflationary pressure, in the IMF's sense, would show up in broader consumer prices and in spending. Neither has appeared yet.
Global implications
China's producer prices matter abroad because its exports carry them. The October breakdown suggests that inflation from China is reaching other countries mainly through industrial inputs and electronics, not finished consumer goods. Factory-gate prices rose 16.4% for chemical raw materials, 16.0% for chemical fibres and 18.6% for non-ferrous metal smelting. They fell for clothing (−1.3%) and articles for daily use (−0.7%).
That inference has a limit. The PPI measures domestic factory-gate prices, not export prices, and the NBS figures do not show how much of the 28.7% rise in export values reflects prices. Countries that import Chinese chemicals, metals and electronics are the most exposed to the price rise. Countries that mainly import finished consumer goods from China are the least exposed.
The import side runs the other way. Imports rose 34.7% in yuan in October, faster than exports, consistent with China paying more for imported energy. The October trade surplus was still about 712.7 billion yuan.
What happens next
The NBS's 2026 release calendar, which the NBS describes as preliminary, sets the next data points. Industrial profits for January–October are due on 27 November, the November PMI on 30 November, November CPI and PPI on 9 December, and November activity data on 15 December.
Three indicators will show whether the shock is broadening. The first is core CPI, which slowed to 0.8% in October. The second is the PPI for consumer goods, still slightly negative. The third is retail sales, which grew 0.4% in nominal terms. If all three rise, the price increase is spreading to consumers. If energy prices ease, the PPI could fall back about as quickly as it rose, because energy and chemicals drove the October increase.
Conclusion
China's factory-gate inflation of 5.7% is real but narrow. Nine energy, chemical, metal and electronics industries account for more than all of it. On the consumer side, gasoline accounts for most of the 0.7% rise. Weak retail sales and falling investment show that domestic demand has not recovered. For the rest of the world, the price pressure from China is reaching industrial inputs and electronics, while finished consumer goods remain cheap.
The data and the working
All inputs are NBS figures; calculations were run in Python.
- Gap between PPI and CPI: 5.7 − 0.7 = 5.0 percentage points (October); 5.0 − 0.9 = 4.1 points (September).
- Input versus output prices: purchasing prices 7.9% − PPI 5.7% = 2.2 points (October); 6.9 − 5.0 = 1.9 points (September).
- Rest of industry: headline PPI 5.7 − contribution of the nine named industries 6.14 = −0.44 points. Contributions are the NBS's approximate figures.
- CPI without gasoline: 0.7 − 0.63 = 0.07 points.
- Other non-energy industrial consumer goods: 0.30 − 0.26 = 0.04 points.
- Real retail sales (approximation): (1.004 / 1.008) − 1 = −0.4%, deflating nominal retail sales by the CPI for consumer goods. This is an approximation, because the NBS does not publish a retail sales deflator in the release.
- Two-year PPI change: (1 − 0.021) × (1 + 0.057) − 1 = 3.5%, about 1.7% a year. The NBS moved the PPI to a 2025 base period in January 2026. It estimates that the change shifts year-on-year rates by about 0.08 points on average, so the chained figure is approximate.
- Cumulative PPI, April–October 2026: monthly changes of 1.7, 0.5, −0.3, −0.7, 0.4, 1.2 and 0.7% compound to 3.5%.
- Two-year export change: (1 − 0.008) × (1 + 0.287) − 1 = 27.7%, about 28%.
- Trade surplus, October: exports 2,790.5 − imports 2,077.8 = 712.7 billion yuan.
Related reading
Brent crude oil price indicator, Energy prices are forecast to ease in 2027. Food prices are not, Japan's economy stalls in the third quarter as imports surge, Understanding inflation: how rising prices are measured and Monetary policy explained.
FAQ
What was China's producer price inflation in October 2026? China's producer price index for industrial products was 5.7% higher in October 2026 than a year earlier, according to the National Bureau of Statistics. It was the fastest annual rise since June 2022, when the rate was 6.1%.
What is the difference between the PPI and the CPI? The producer price index measures the prices industrial firms receive when they first sell their products, at the factory gate. The consumer price index measures the prices households pay for a basket of goods and services. In China in October 2026, the PPI rose 5.7% and the CPI 0.7%.
Why are China's producer prices rising? The National Bureau of Statistics attributes the monthly rise mainly to higher international energy prices and to winter demand for coal and gas. It also cites capacity management in some industries and demand linked to artificial intelligence. Coal mining, oil and gas, refining, chemicals, metals and electronics accounted for most of the rise.
Is China still facing deflation? Headline prices are no longer falling: consumer prices rose 0.7% and core prices 0.8% in October 2026. But gasoline accounted for most of the CPI rise, core inflation slowed from 1.0% in September, and retail sales volumes were roughly 0.4% lower than a year earlier. Weak demand has not ended.
Does China's producer price rise mean higher import prices for other countries? The rise is concentrated in industrial inputs and electronics, such as chemicals, metals and computer equipment. Factory-gate prices of consumer goods were slightly lower than a year earlier. The PPI measures domestic prices, not export prices, so its effect on other countries' import costs is an inference.
Sources
- National Bureau of Statistics of China: Industrial Producer Price Indexes in October 2026, released 9 November 2026 (English version dated 10 November)
- National Bureau of Statistics of China: Consumer Price Index in October 2026, released 9 November 2026 (English version dated 10 November)
- National Bureau of Statistics of China: Dong Lijuan, Chief Statistician of the Department of Urban Surveys, interpretation of October 2026 CPI and PPI data (in Chinese), 9 November 2026
- National Bureau of Statistics of China: National Economy was Generally Stable with Innovation-Led and High-Quality Development in October, 16 November 2026
- National Bureau of Statistics of China: Profits of Industrial Enterprises above the Designated Size from January to September in 2026, 28 October 2026
- National Bureau of Statistics of China: Industrial Producer Price Indexes in September 2026, 14 October 2026
- National Bureau of Statistics of China: Consumer Price Index in September 2026, 14 October 2026
- National Bureau of Statistics of China: Consumer Price Index in August 2026, September 2026
- National Bureau of Statistics of China: Industrial Producer Price Indexes in August 2026, September 2026
- National Bureau of Statistics of China: Industrial Producer Price Indexes in July 2026 and Consumer Price Index in July 2026, August 2026 · release 2
- National Bureau of Statistics of China: Industrial Producer Price Indexes in June 2026 and Consumer Price Index in June 2026, July 2026 · release 2
- National Bureau of Statistics of China: Industrial Producer Price Indexes in May 2026, June 2026 (Chinese version notes the 2025 base-period change) · release 2
- National Bureau of Statistics of China: Industrial Producer Price Indexes in April 2026, May 2026
- National Bureau of Statistics of China: Producer Prices in the Industrial Sector for June 2022 and for July 2022 · release 2
- National Bureau of Statistics of China: Producer Price Index in the Industrial Sector for June 2023, June 2024 and June 2025 · release 2 · release 3
- National Bureau of Statistics of China: National Economy was Generally Stable with Sustained Momentum of Steady Progress in October (October 2025 data), 14 November 2025
- National Bureau of Statistics of China: Regular Press Release Calendar of NBS in 2026
- International Monetary Fund: IMF Executive Board Concludes 2025 Article IV Consultation with China, Press Release No. 26/053, 18 February 2026
Disclaimer: This article is for informational purposes only and does not constitute investment advice. EconoLens is not a SEBI-registered investment advisor. Please consult a qualified financial advisor before making investment decisions.
This article covers China's producer and consumer prices; it does not attempt an India-specific assessment, as the release shows no direct India channel.
Primary Sources
Cite This Article
Khagan Rao. (2026, November 17). China's Factory Prices Rise 5.7% While Consumer Prices Rise 0.7%: A Narrow Shock, Not a Broad Demand Recovery. EconoLens. https://www.econolens.co.in/news/china-factory-gate-inflation-october-2026-ppi-cpi-gap
Khagan Rao is an economist and analyst specialising in global monetary policy, fiscal frameworks, and international trade. He tracks publications from the IMF, World Bank, BIS, and RBI to deliver accessible, data-driven analysis for a global audience.